Westside and South Bay price per square foot analysis: 2007 vs. 2010
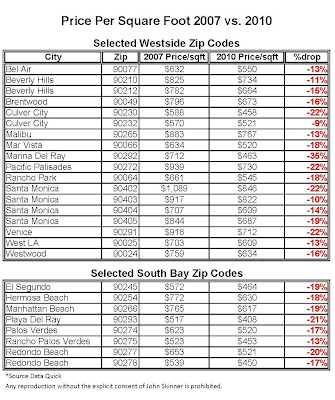
Check out the graph below which provides the price per square foot in 2007 vs. 2010 in most Westside and South Bay zip codes. Overall, we see about a 20% drop over the three year period. Most of these zip codes hit their peak in 2006/2007 so this is a good indicator of how far these areas have fallen from the inflated peak. Zeroing in on specific zip codes is also very important since most Westside/South Bay markets operate in a “micro” fashion. For instance, the 90402 zip code in Santa Monica (North of Montana) is down 22% while 90403 (South of Montana) is only down 10%. Please note these numbers are a combination of Single Family Homes and Condominiums and price per square foot is only one of quite a few ways to value a property.
 *click on image for larger view